Was the August 2015 Stock Market Decline The Seventh Inning Stretch For The Real Estate Cycle?

Eventually imbalances and overvaluations give rise to corrections we call recessions. Last weeks, the overvaluations and imbalances in the Chinese stock market and economy started to correct and gave rise to over a 10% decline in the SP 500.  Such declines do not always give rise to recessions and do not foreshadow future economic peril.  For example, in the third quarter of 2011, although  the S&P 500 declined over 12%, the economic recovery continued to proceed for four additional years.  Many large stock market declines over multiple   quarters occur  just before or during the early stages of the recession.  These losses are large and reflect the current deteriorating state of affairs.

Smaller stock market hiccups have presaged  recessions by one to two years and reflect cracks and strains in the economy. Such hiccups have occurred in 1978 (Oil Shock), Oct 1987, 1998 (Russian Financial Crisis).  The cracks and strains in major economic pillars  presage economic troubles, not the stock market declines.  Indeed, there was no stock market hiccup that proceeded by one or two years the 2008 recession.  By the time the stock market dived,  the recession soon followed. However, the housing market had already started to crack in some parts of the country as early as 2006 and the subprime market soon followed.

Last week’s events showed strains in the Chinese economy and its impact on domestic prosperity.  Despite these strains, the economy can keep chugging up, but other strains and imbalances will continue to grow. No other domestic indicators show any problems, and short term interest rates are still zero. The yield curve is still very positive.  Perhaps, these recent strains signal that we are in a latter  but not final inning of this cycle.

Problems Arise From the Movement of New Companies and Residents to Gentrifying Areas in Los Angeles and San Francisco

Gentrifying neighborhoods are seeing the influx of new companies and residents as developers create new offices and  apartments in the Art District in Downtown Los Angeles, Hollywood, Mid Market San Francisco, and the Mission District in San Francisco.  Rents are rising rapidly in those neighborhoods.  Many of the existing residents in these areas are protected by rent control.  On the contrary, those that are not protected are seeing their rents spike.

At the same time, these gentrifying areas are also seeing an increase in the homeless population.  This is a result of a combination of  early release from prisons, rising rents, stagnant wages, warm weather, and  new construction disrupting former homeless hangouts.  Locals and activists are calling for more aid, rent control, and less enforcement of homeless encampment laws.  Both activists and the real estate community agree that part of the solution is developing more affordable housing.

New residents and workers are encountering more homeless encampments.  The solution remains elusive.  Even in Venice, a mature neighborhood way down the gentrification road– where homes sell for over $1,000 per square foot– struggles for answers to this social issue.

The article below discusses the clash of new technology companies with lower income and homeless residents in the mid market neighborhood of San Francisco.

Blending Tech Workers and Locals in San Francisco’s Troubled Mid-Market – The New York Times.

Los Angeles Ranked the #3 City in the World for Startups

Los Angeles is ranked #3 as the leading City for startups.   Compass and Techcrunch ranking gauges the world’s leading startup ecosystems—the broad infrastructure of talent, knowledge, entrepreneurs, venture capital, and companies that make up a startup community. The report measures these ecosystems based on their quality of talent, pool of venture capital resources, experience and mentorship provided by startup founders, market reach of their companies, and the ultimate performance and exit value of their companies. Increasingly, the global economy will be defined by the startups and entrepreneurs that are making tomorrow’s technologies a reality, according to Bjoern Lasse Herrmann, the chief executive at Compass. Herrmann believes a nation’s strength will continue to rest on the shoulders of hundreds of innovative small businesses. Herrmann says: “As the Industrial Economy falls away with increasing speed and half the world’s current jobs will be replaced by software, it becomes critical  to build thoughtful programs to nurture the entrepreneurial renaissance that will take its place.”

Los Angeles will gain economic traction as it continues to produce new business.


The World’s Leading Cities for Startups and Innovation – CityLab.

How to Tell If You are in the Last Innings of the Real Estate Cycle

chart_bull_market.top

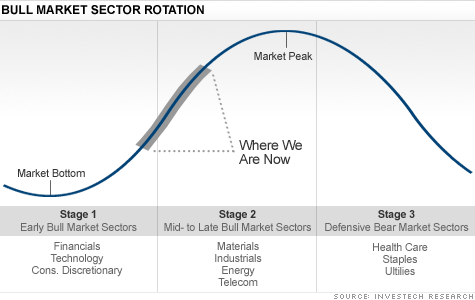
Moderators at every real estate conference ask their speakers to comment on what inning of the cycle they believe we are in. Howard Marks of Oaktree Capital says we cannot predict the timing of the cycle– we can only recognize where we are now. Unfortunately, we cannot predict the length of the latter stage. It is during this stage that excesses are produced and expanded upon. Up it goes until it blows.

Over the last 30 years, I’ve been able to identify certain events, signs and trends that have occurred at the latter stages of some cycles. Not every one of these indicators have appeared during all the maturing cycles.

1. Prices and rents soar substantially above their previous peak. The new records are discussed at parties, conference, and dinner conversations and described as “crazy.”

2. Property prices and construction costs are climbing but developers/investors count on rising rents or prices to make their projection. Worse yet, developers trend up their projected rents or prices.

3. A form of very high leverage debt enters the market shifting the risk from equity to credit and increasing equity yields. Worse yet, the debt is non-recourse.

4. There is noticeable jealousy between the guys doing deals or selling properties and making significant amounts of money. Some developers and investors are achieving spectacular results.

5. The Fed is raising interest rates.

6. New construction reaches very high historical levels in some real estate markets and/or real estate property types.

7.  Mortgages are easy to get, and there is a lot of competition among lenders.

8. Some lenders start to lend more on appraised value and are less restrained by cost on recently acquired deals or new construction.

9.  Politicians and activists become more focused on the problems of growth and inequality than on the creation of jobs.

10.  Architects are very busy, and it is hard to get things through the City.

11.  The high prices and high levels of new construction are justified by supply and demand projections and changes in society and demographics making this time different. Some justify the prices paid or low expected yields by reference to the long term.

12.  Few are predicting an imminent recession.

13.  Good acquisition people are in short supply and being paid increasing amounts of money.

There could still be remaining runway, even after these signs appear.  For example, the latter stages of the last housing boom in Los Angeles lasted from 2005 through mid 2008.   It is just a risk call. Indeed, the latter innings are usually the most glorious of all, and one can make a lot of money if they play it right– or crash.   For the risk averse, when the signs appear,  it may be time to leave the casino and enjoy the floor show.

LA Multifamily Permits Soar In First Half of 2015

2015 Annualized Permit Rate Highest Since 1988

2015 Annualized Permit Rate Highest Since 1988

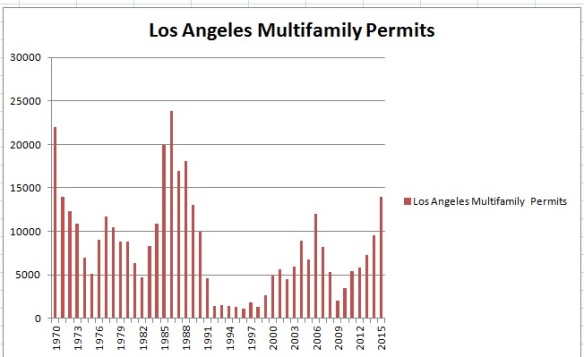
Building permits issues in the City of Los Angeles soared in the first half of 2015. The City issued over 7,000 multifamily permits in the first half of 2015 versus 9,500 permits for the entire year in 2014.   At this rate, Los Angeles will issue 14,000  multifamily permits in 2015–which would be the highest level since 1988.

The Commerce Department says that metro LA saw permits issued for just under 20,000 residential units (total of all units in the metro area versus the City of Los Angeles) in the first six months of 2015, up 41.4 percent from the same time last year.

We addressed the implications of the building permit data in our blog of May 2015 below.

Are We Going to Have too Much Apartment Construction in Los Angeles? | PMI Properties.